$('.iChart').iguanaChart(
{
ticker:"AAPL.US",
date_from: "01.01.2015",
date_to: "01.01.2016",
dataSource: $.extend(true, {}, iChartDataSource)
}
);
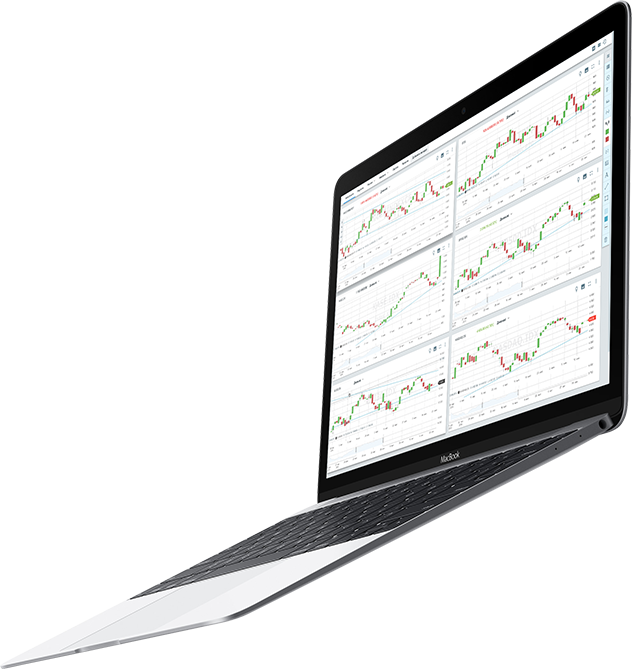
IguanaCharts has several chart types - bars, candles and line, each of one helps analyze the market at a different angle. Drawing tools help you understand what stock prices are doing, and track how your predictions turn out. You can write on your chart or do freehand drawings, drag simple trend lines from A to B, apply the widespread Fibonacci tools, or apply the simple lines and channels.
Candlestick Chart
Bar Chart
Line Chart
Volume (Horizontal)
Volume (Vertical)
Free Line
Arrow
Horizontal Line
Vertical Line
Channel
Corner Trend
Fibonacci Fan
Fibonacchi Retracement
Fibonacci Archs
Triangle
Rectangle
Ellipse
Poligon
Add Text
Add Icon
Iguana Charts comes with a massive library of prebuilt technical indicators.
The Accumulation Distribution (AD) formula estimates the intensity of price change by calculating a ratio between value and price. The probability of higher prices increases as the AD line rises.
Chaikin Oscillator is a difference between 3 days EMA of Accumulation/Distribution ratio and 10 days EMA of Accumulation/Distribution ratio.
The Average Directional Movement indicator is used to determine the probable direction of the main trend.
The Aroon indicator used to study the strength and direction of the trend./p>
The Average True Range (ATR) indicator measures volatility by comparing the distance between daily price highs and lows.
Bollinger Bands are plotted on the price chart as upper and lower standard deviations from a moving average, allowing users to view average longer-term price ranges.
Momentum indicator compare prices against their moving averages. The further the price is from the moving average, the greater the momentum.
The Chaikin Volatility indicator is a price envelope system, similar to a Bollinger Band, which highlights the average price highs and lows on the chart.
The Detrended Price Oscillator removes the trend from the price in order to help investors better identify price cycles.
An Exponential Moving Average (EMA) is an average of data calculated over a period of time, which gives more weight to the most recent trading days.
Envelopes are lines plotted above and below a moving average. They typically represent the standard deviation of a price range.
Moving Average Convergence/Divergence (MACD) indicator plots a slower moving average line (26-day EMA minus the 12-day EMA) and a faster 9-day EMA as a signal line. Buy and sell signals occur when the fast line crosses up or down over the slower average.
The median price - the average price for the day, which can be used as a filter for the trend indicator.
The Money Flow indicator compares the volume on up price moves against the volume on down price moves in order to measure money flowing into or out of a particular security.
The On Balance Volume (OBV) indicator measures positive and negative volume flow.
Parabolic SAR (stop-and-reverse) is an indicator used for analyzing trending markets and providing entry and exit points.
The Rate of Change (ROC) indicator compares a specified closing price with the current price. In other words, it measures the percent change from one period to the next.
The Relative Strength Index (RSI) is a momentum oscillator that compares upward movements of the closing price with downward movements, and results in values that range from 0 to 100.
The Simple Moving Average (SMA) is an average of data calculated over a specified period of time. This moving average is the most popular price indicator used in technical analysis, and can be used with any price.
Standard Deviation is used to indicate volatility. It measures the difference between values, for example, the difference between closing price and the moving average.
The Triple Exponential Moving Average (TEMA) is a composite of three moving averages of closing prices. Its purpose is to eliminate short cycles. This indicator keeps the closing price in trends that are shorter than the specified period.
The Triangular Moving Average is an average of data calculated over a period of time where the middle portion of data has more weight.
Typical Price is the average value of daily prices, and can be used as a filter for trend indicators.
The Price Volume Trend is a cumulative volume that is calculated based on the relative changes of the closing price, and should be used with other indicators.
The Weighted Close formula calculates the average value of daily prices. The only difference between Typical Price and the Weighted Close is the closing price is considered most important, so is given extra weight.
Williams %R is a momentum indicator, and is used to measure overbought and oversold levels.
The Weighted Moving Average is an average of data calculated over a specified period of time, where greater weight is attached to the most recent data.
Trend planimetry
//Create a button, assign it an instument
<div name="SelectInstrument" data-instrument="Arrow" class=""></div>
//Catch a click on a button to start drawing
$(document).on("click", "[name='SelectInstrument']", function(){
$("#iChart").iguanaChart("toolStart", $(this).data("instrument"));
});
//Easily change chart themes to White or Dark
$("#iChart").iguanaChart("setTheme", 'White');
//or Dark
$("#iChart").iguanaChart("setTheme", 'Dark');
//Use the Power of TA lib in JS with single stroke of code
$("#iChart").data("iguanaChart").TA.EMA(1,1,{TimePeriod: 20});
If you need help to setup your own DataSource or trading API to trade from the chart - please contact us and we will help.
Support is 30€ per hour with 10 hours minimum.